Visualising OpenCL Timelines with NVVP
NOTE: The techniques described below do not work for CUDA toolkit versions newer than 7.5.
NVIDIA have a visual profiler (NVVP) which used to be a fantastic tool for analyzing OpenCL applications running on NVIDIA GPUs. Unfortunately, as NVIDIA let their OpenCL support stagnate, the OpenCL portion of NVVP has ceased to function (the CUDA side of this tool was kept up-to-date, of course). This has been the case for several years now, although we remain optimistic that this situation will change (for the better) in the near future, now that NVIDIA seem to be back on the OpenCL bandwagon.
In the meantime, we’ve found a way of continuing to use NVVP for visualising OpenCL application timelines, as well as displaying a few other basic OpenCL kernel performance metrics. This is possible by using the little-known Command-line Profiler functionality in NVIDIA’s drivers. This profiling tool is controlled via a set of environment variables, which instruct the driver to collect a small set of metrics for each OpenCL command enqueued to a device.
To enable the profiler, we simply set the following environment variable:
COMPUTE_PROFILE=1
If we run an application that uses OpenCL with this environment variable set, the driver will dump a profiling log to opencl_profile_0.log.
Here’s an example log for a simple N-Body application running on an NVIDIA Tesla K40c.
You can see each individual kernel invocation with their runtime and occupancy, as well as the host<->device data transfers.
# OPENCL_PROFILE_LOG_VERSION 2.0
# OPENCL_DEVICE 0 Tesla K40c
# OPENCL_CONTEXT 1
# TIMESTAMPFACTOR 13d97a5aebb85609
method,gputime,cputime,occupancy
method=[ memcpyHtoDasync ] gputime=[ 11.776 ] cputime=[ 16.856 ]
method=[ memcpyHtoDasync ] gputime=[ 11.776 ] cputime=[ 13.271 ]
method=[ nbody ] gputime=[ 1319.776 ] cputime=[ 13.028 ] occupancy=[ 0.750 ]
method=[ nbody ] gputime=[ 1320.928 ] cputime=[ 7.247 ] occupancy=[ 0.750 ]
method=[ nbody ] gputime=[ 1322.528 ] cputime=[ 5.614 ] occupancy=[ 0.750 ]
method=[ nbody ] gputime=[ 1321.152 ] cputime=[ 5.801 ] occupancy=[ 0.750 ]
method=[ computeDistances ] gputime=[ 3969.152 ] cputime=[ 8.967 ] occupancy=[ 1.000 ]
method=[ memcpyDtoHasync ] gputime=[ 21539.264 ] cputime=[ 22108.943 ]
method=[ nbody ] gputime=[ 1320.064 ] cputime=[ 6.863 ] occupancy=[ 0.750 ]
method=[ nbody ] gputime=[ 1320.704 ] cputime=[ 3.505 ] occupancy=[ 0.750 ]
method=[ nbody ] gputime=[ 1320.768 ] cputime=[ 3.172 ] occupancy=[ 0.750 ]
method=[ nbody ] gputime=[ 1319.936 ] cputime=[ 3.655 ] occupancy=[ 0.750 ]
method=[ computeDistances ] gputime=[ 3971.616 ] cputime=[ 3.526 ] occupancy=[ 1.000 ]
method=[ memcpyDtoHasync ] gputime=[ 10899.968 ] cputime=[ 11028.222 ]
method=[ memcpyDtoHasync ] gputime=[ 12.736 ] cputime=[ 26.873 ]
Now, the documentation for NVVP states that we can import data from a command-line profiling session into the visual profiler for inspection.
All we need to do is change the output format to CSV, and request a couple of extra metrics from the profiler, which we can achieve by providing a config file to the COMPUTE_PROFILE_CONFIG environment variable, with a list of additional metrics we wish to collect.
So, we can create a nvvp.cfg file with the following contents:
profilelogformat CSV
streamid
gpustarttimestamp
gpuendtimestamp
and then execute our application with the necessary environment variables:
COMPUTE_PROFILE=1 COMPUTE_PROFILE_CONFIG=nvvp.cfg ./nbody
This time we get a log in a CSV format, with the extra metrics we requested:
# OPENCL_PROFILE_LOG_VERSION 2.0
# OPENCL_DEVICE 0 Tesla K40c
# OPENCL_CONTEXT 1
# OPENCL_PROFILE_CSV 1
# TIMESTAMPFACTOR 13d97a5aea505c75
gpustarttimestamp,gpuendtimestamp,method,gputime,cputime,occupancy,streamid
13e224f5a60f82e0,13e224f5a60fb0e0,memcpyHtoDasync,11.776,36.645,,12
13e224f5a6111680,13e224f5a6114480,memcpyHtoDasync,11.776,30.470,,12
13e224f5a6131880,13e224f5a62745c0,nbody,1322.304,21.637,0.750,12
13e224f5a6280720,13e224f5a63c34a0,nbody,1322.368,10.148,0.750,12
13e224f5a63ccf40,13e224f5a650f9c0,nbody,1321.600,8.097,0.750,12
13e224f5a6518d20,13e224f5a665b3c0,nbody,1320.608,8.407,0.750,12
13e224f5a6698920,13e224f5a6a62b80,computeDistances,3973.728,8.471,1.000,12
13e224f5a6a6bc80,13e224f5a811f0c0,memcpyDtoHasync,23802.943,24369.047,,12
13e224f5a81ae5a0,13e224f5a82f0dc0,nbody,1320.992,5.908,0.750,12
13e224f5a82f6020,13e224f5a8438800,nbody,1320.928,3.705,0.750,12
13e224f5a843dfe0,13e224f5a8580dc0,nbody,1322.464,3.678,0.750,12
13e224f5a8585fa0,13e224f5a86c8860,nbody,1321.152,4.044,0.750,12
13e224f5a86cd2c0,13e224f5a8a97400,computeDistances,3973.440,3.468,1.000,12
13e224f5a8a9bc20,13e224f5a951cee0,memcpyDtoHasync,11014.848,11153.955,,12
13e224f5a9541d40,13e224f5a9544f00,memcpyDtoHasync,12.736,44.480,,12
So, we should be able to just import this into NVVP, right?
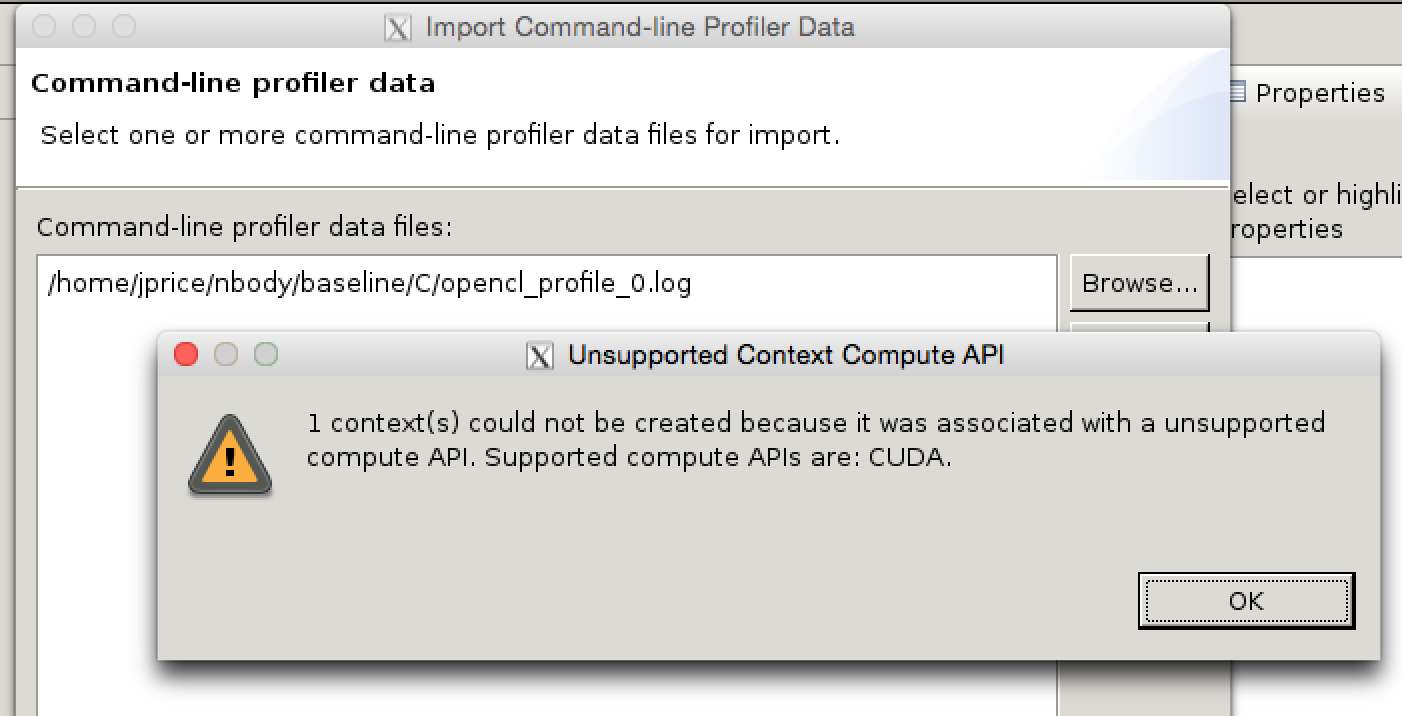
Alas, OpenCL is considered an ‘unsupported compute API’, and we’re told that CUDA is the only option.
We’re not beaten yet though.
Our OpenCL profiling log contains a bunch of data which should be independent of the compute API used to generate it.
The only part of the log indicating that we used OpenCL is the header, which has tags such as OPENCL_CONTEXT.
What happens if we just replace these OPENCL_ tags with CUDA_ tags?
sed 's/OPENCL_/CUDA_/g' opencl_profile_0.log >cuda_profile_0.log
On Windows, a simple find-replace in notepad will also do the trick.
I’ve named the new log cuda_profile_0.log just for kicks.
Now we go back to NVVP and go through the same File->Import...->Command-line Profiler sequence, and…
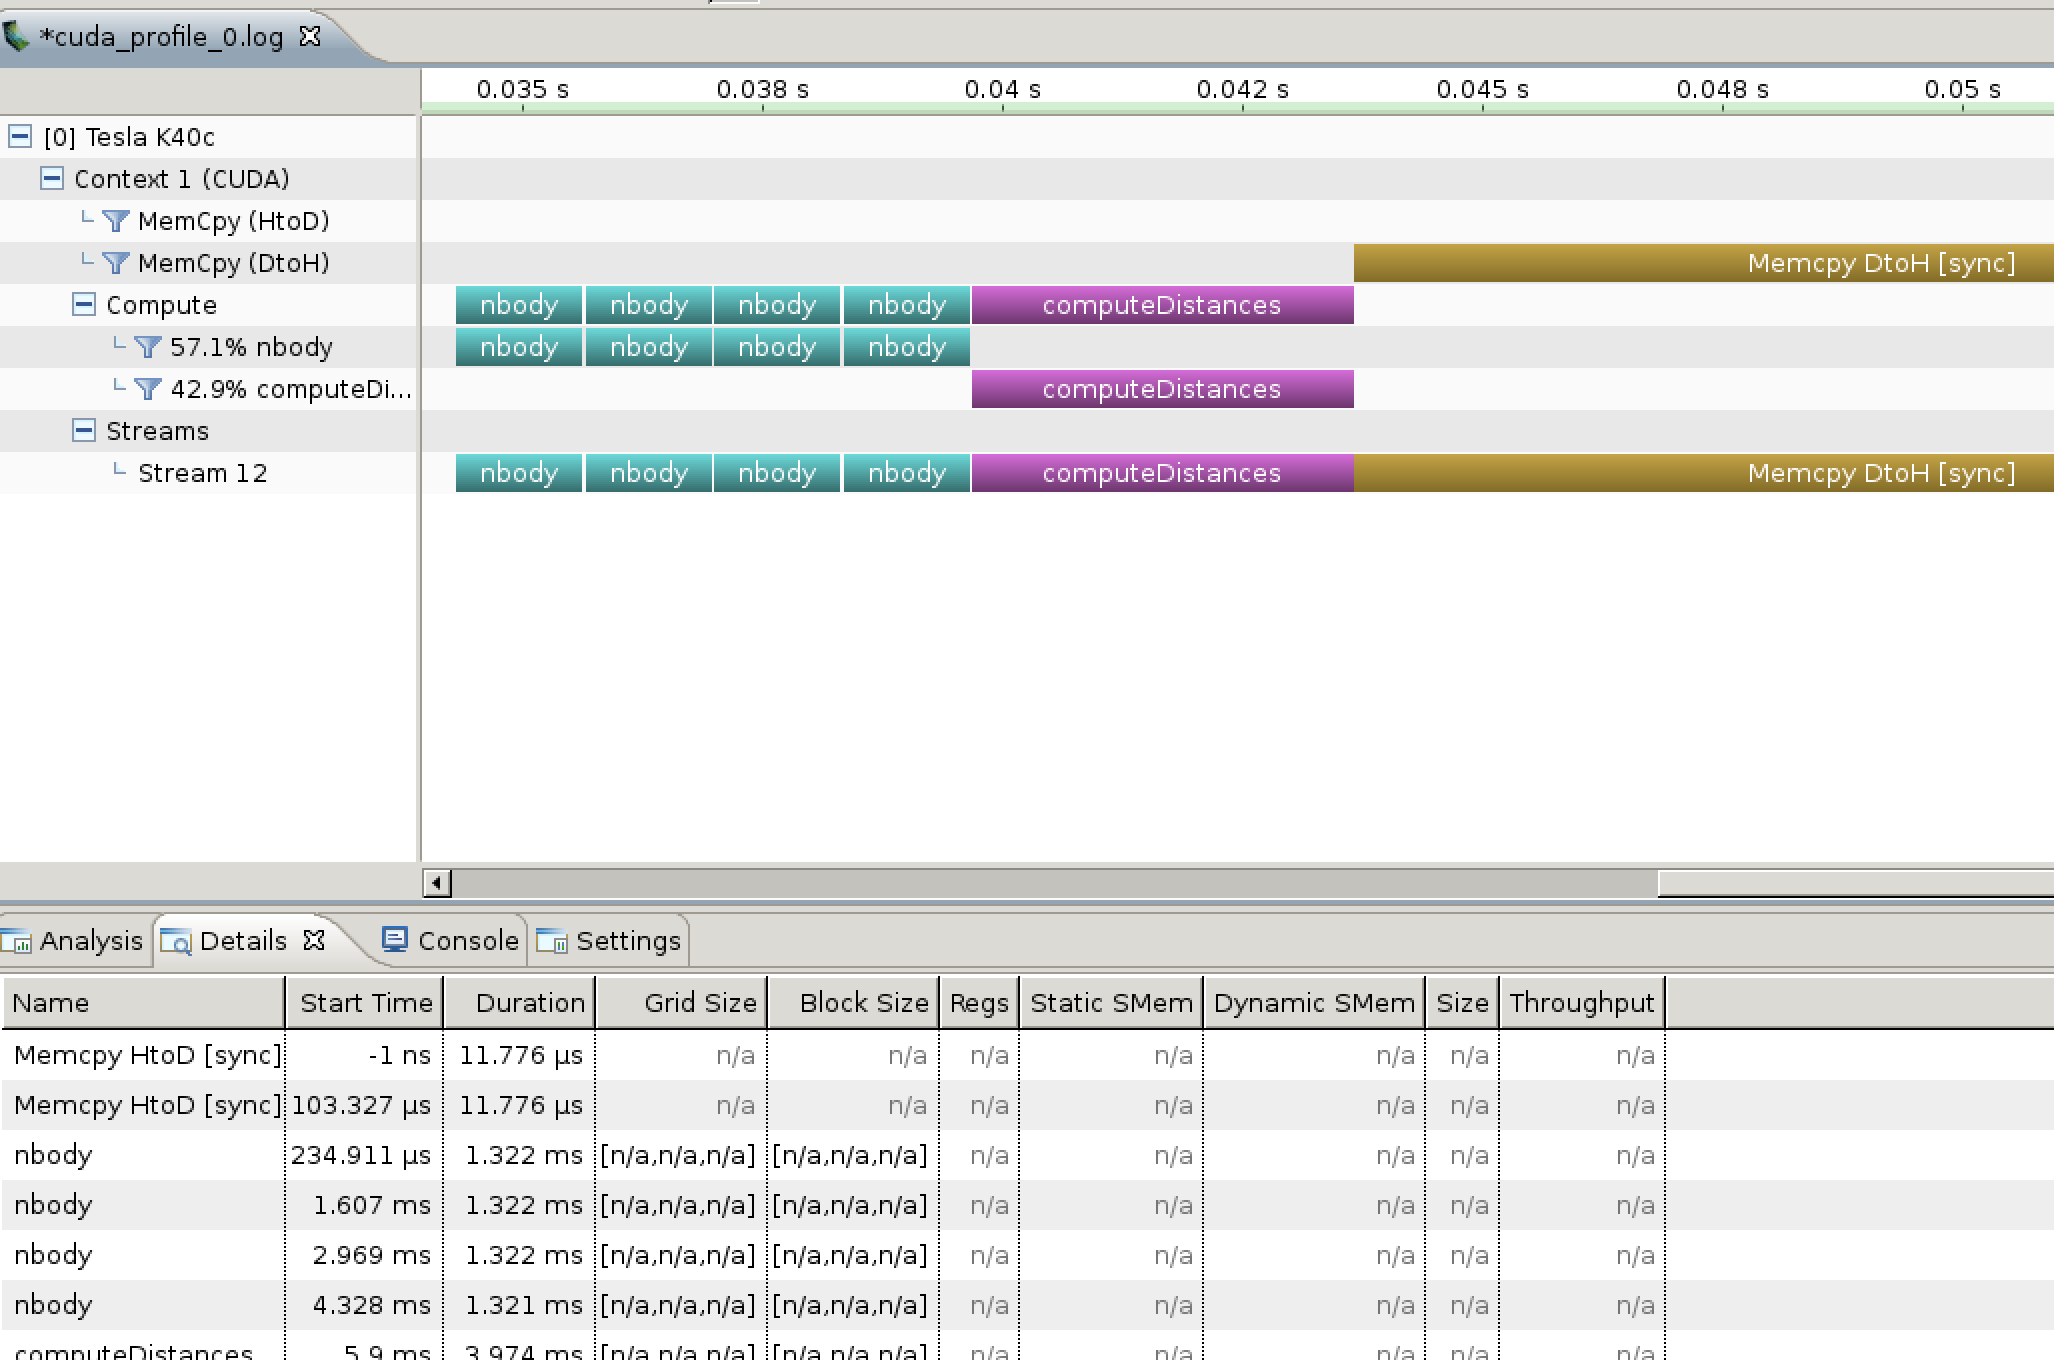
Success!
NVVP is perfectly happy with the data in the log, it just refused to do anything with it because it had the word OPENCL in the header.
We can now visually inspect the application timeline, which can help us quickly identify which kernels or memory transfers are the bottlenecks, or whether the GPU is unnecessarily idle at any point.
This is pretty helpful, but we can do better.
You’ll notice in the above screenshot that many of the additional metrics are marked as n/a, which simply indicates that the data isn’t present in the profiling log.
We can amend this by adding to the config file we created earlier:
profilelogformat CSV
streamid
gpustarttimestamp
gpuendtimestamp
gridsize
threadblocksize
dynsmemperblock
stasmemperblock
regperthread
memtransfersize
The set of metrics you can add to this config file are listed here. There’s a few more substitutions we need to make to the log now, to convert some OpenCL terminology into CUDA terminology. Here’s the SED script that I used:
s/OPENCL_/CUDA_/g
s/ndrange/grid/g
s/workitem/thread/g
s/workgroupsize/threadblocksize/g
s/stapmemperworkgroup/stasmemperblock/g
This time when we import our profiling log, we get a much more useful set of metrics, such as the amount of registers and local memory each kernel uses, and the throughput of our host<->device transfers:
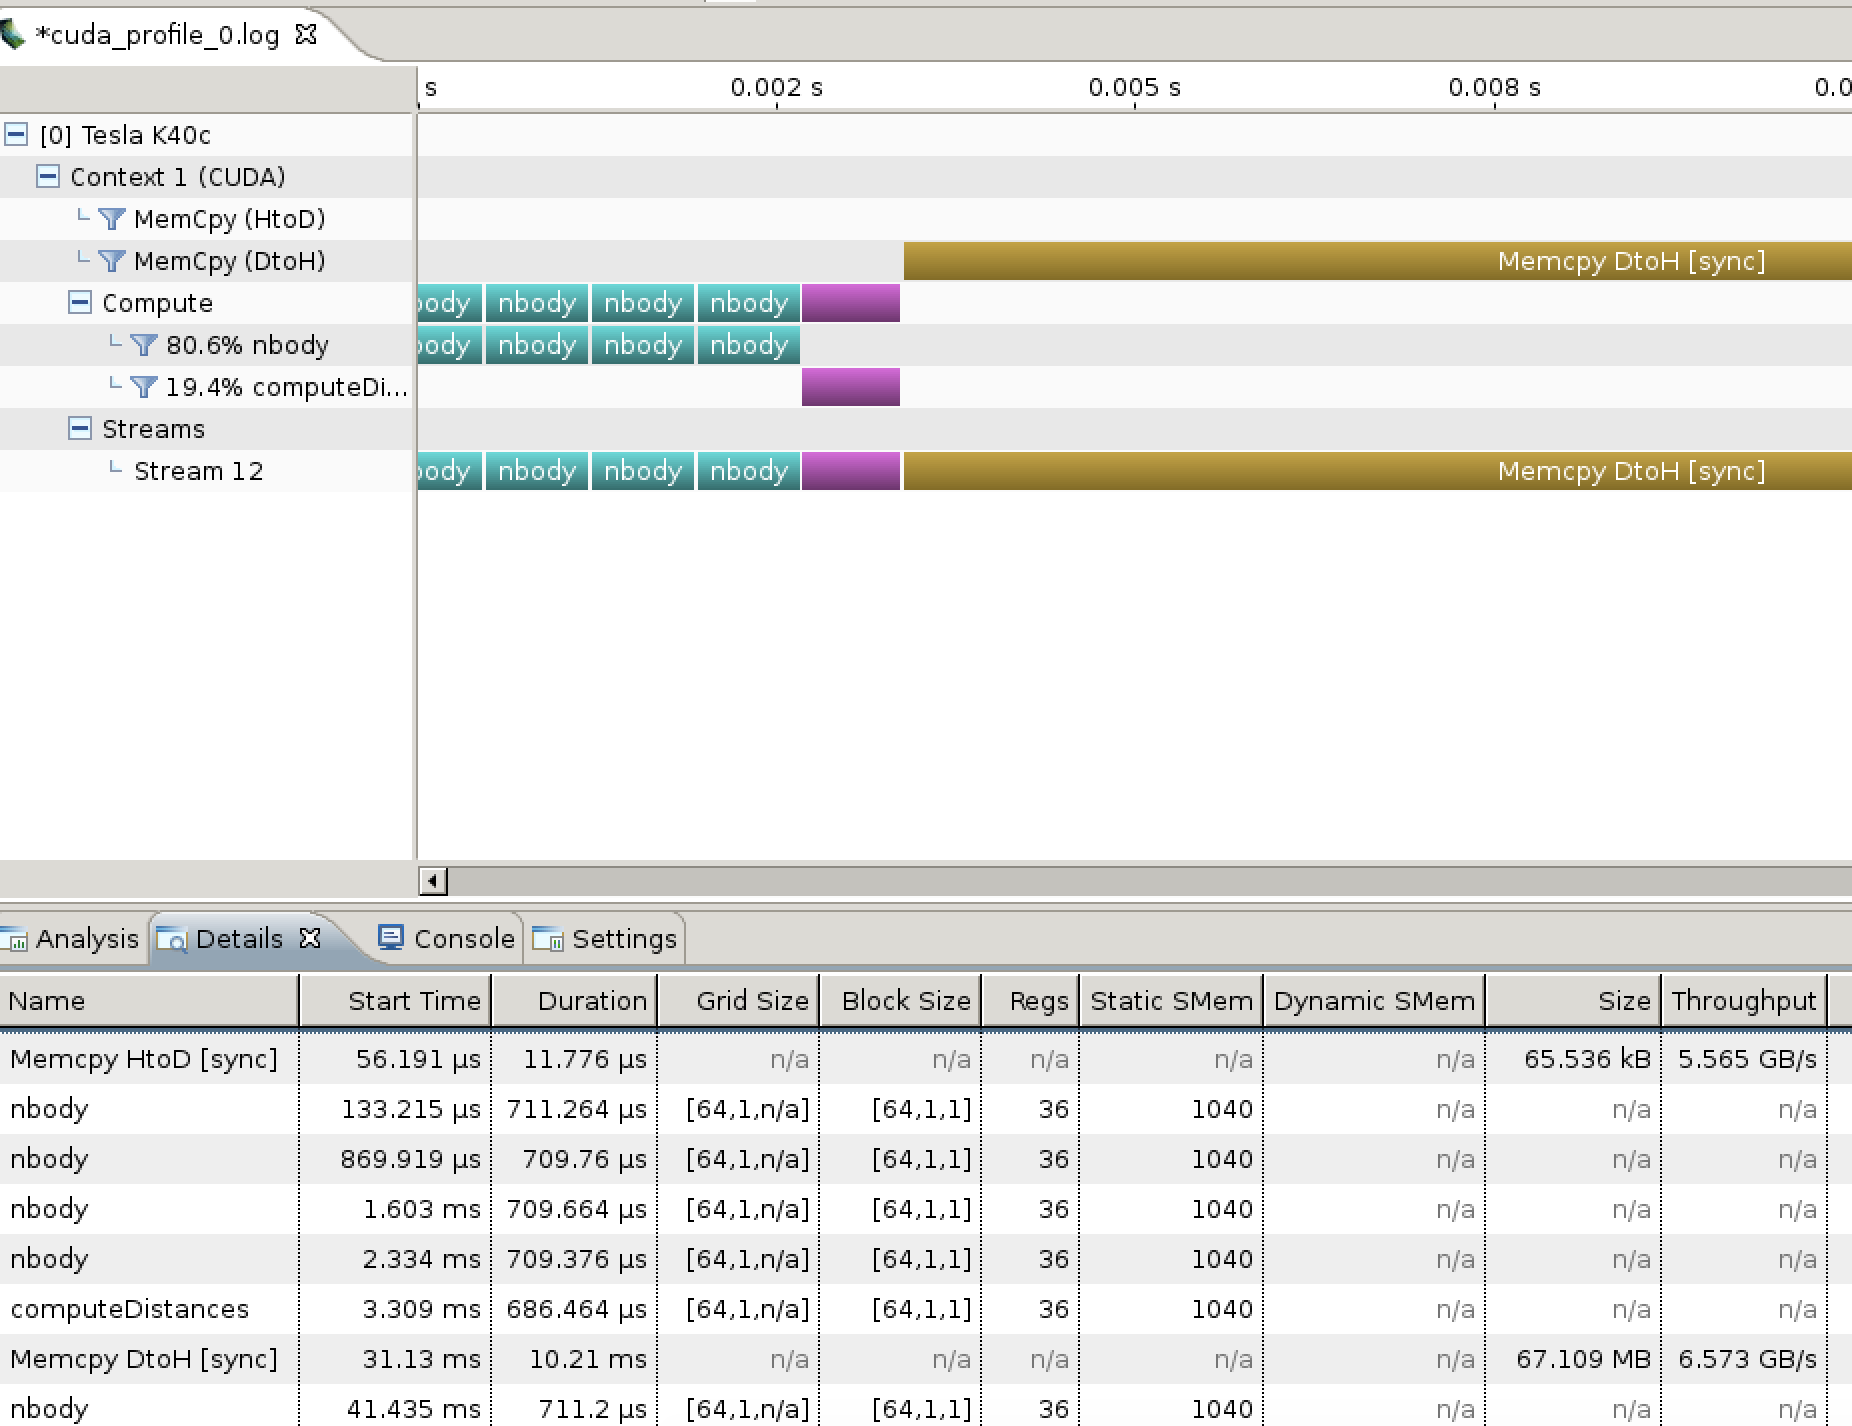
It may also be possible to collect additional metrics listed by nvprof --query-events, although you may have to make further substitutions to CUDA-ify the resulting log.
This process is far from ideal, but until NVIDIA update NVVP to fix OpenCL support, this is the best we can do.
We’re optimistic that NVIDIA will indeed fix NVVP at some point.
The above was performed on a Linux box with driver 349.16 and CUDA toolkit 7.0.28.